
![]()
- Economic growth appears to have averaged close to 2% in the first half of 2023, easing fears of an imminent recession.
- Moreover, the most cyclical parts of the economy- homes sales, light vehicle sales, and capital spending- all topped expectations in the first half of the year.
- Job growth has also proved resilient, although the pace has moderated, and the breadth of job gains has narrowed.
- Headline inflation has decelerated considerably, and core inflation is showing increasing signs of moderating, allowing the Fed to wind down their rate hikes.
- A majority of economists, including us, still see a mild recession as more likely than not later this year or in early 2024.
- The Fed is expected to hike the federal funds rate at least one more time and hold rates higher for longer. The yield curve is expected to remain inverted through 2024.
Economic growth topped expectations during the first half of 2023, with real GDP likely averaging around a 2% pace and employers adding 1.67 million jobs during the first six months of the year. The stronger-than-expected showing has led some forecasters to pull back their calls for a recession, although more than 60% of professional forecasters, including us, still call for the economy to slip into a modest recession later this year or in early 2024.
Expectations for a recession increased substantially about a year ago, once it became apparent reducing inflation would likely be more problematic and require a much more aggressive monetary policy response. After hiking the federal funds rate a quarter percentage point (25 bp) at its March 2022 meeting, the Fed followed with hikes of 50 bp at its May meeting and 75 bp hikes at each of the next 4 meetings. The Fed dialed back to a 50 bp hike in December and raised rates by 25 bp at its first 3 meetings this year before leaving its federal funds rate target unchanged at its June meeting. We expect the Fed to boost the funds rate another 25 bp at its July 26 meeting, which may mark the last hike of this cycle.
So far, the economy has handled the Fed’s rate hikes remarkably well. The unemployment rate, which is currently 3.6%, is 0.2 percentage points lower than it was when the Fed began to raise interest rates in March 2023. The labor market has loosened up, however, with the number of job openings falling modestly and the pace of nonfarm employment growth decelerating from 561 jobs per month in the first quarter of 2022 to just 244 jobs per month over the past three months. The breadth of job gains has also narrowed, as parts of the economy have been more significantly impacted by rising interest rates.
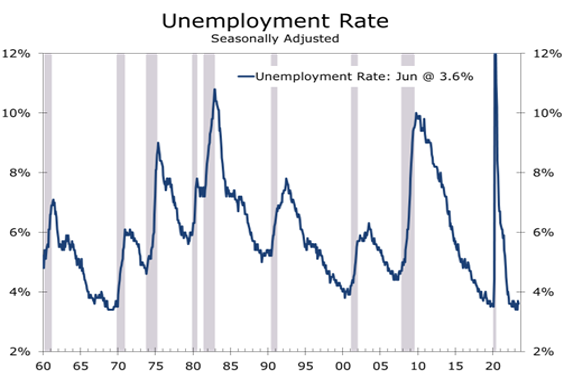
Source: Bureau of Labor Statistics
The labor market’s resilience is a big reason why so much doubt has arisen about a recession. The employment data have historically been the most timely and accurate indicator the National Bureau of Economic Research (NBER) utilizes to help decide when a recession begins. Nonfarm payrolls have been highly correlated with the onset of a recession, often falling in the first month of a downturn. The unemployment rate has typically risen slightly ahead of a recession and an increase of 0.4 percentage points or more has nearly always marked the onset of an economic downturn.
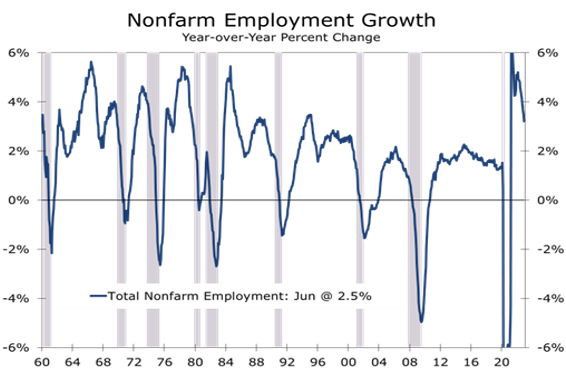
Source: Bureau of Labor Statistics
The NBER defines a recession as a significant decline in economic activity spread across the economy that lasts more than a few months. The NBER weighs three criteria - depth, diffusion, and duration – to determine whether a decline in economic activity has been ‘significant’. The weight of these criteria depends on the circumstances. The recession triggered by the pandemic was unusually short, lasting just 2 months, but was extremely deep and broad-based.
The U.S. has endured 11 recessions since 1950. If you exclude the short pandemic downturn, recessions have lasted for an average of 11 months and have seen real GDP decline 2.1% from peak to trough. The 2007-2009 recession resulting from the Global Financial Crisis was the longest, lasting 18 months.
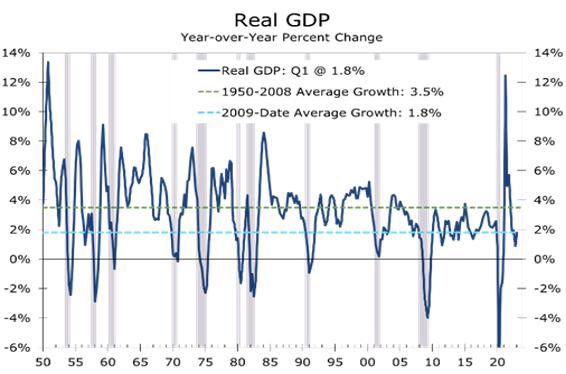 Source: Bureau of Economic Analysis
The NBER analyzes a variety of economy-wide measures of economic activity to identify business cycle peaks, including real personal income less transfer payments, nonfarm payrolls, real personal consumption expenditures, wholesale and retail sales adjusted for price changes, and industrial production.
Both nonfarm payrolls and the household measure of employment continue to grow solidly. Most other key indicators the NBER follows have either slowed or contracted slightly. Real personal income and transfers have come close to stalling this past year but have improved in recent months, while inflation-adjusted retail sales have fallen 2.4% over the past year. Inflation-adjusted sales of manufacturers and wholesalers have fallen for the past 3 months and have risen just 0.3% over the past year. And industrial production is up just 0.2% over the past year.
There are plenty of other warning signs. The Conference Board’s Leading Economic Index (LEI) has declined for 14 months in a row and is currently down 8% year-to-year. The LEI is designed to predict the Coincident Indicator Index, which includes four of the NBER’s six series. As such, the LEI has a good track record of predicting recessions, particularly when it has declined this persistently and by such a large magnitude – duration and depth. The decline has also been broad-based – meeting the dispersion test.
The LEI is designed to predict economic conditions six months out and the most recent string of declines would be consistent with the economy falling into recession during the second half of this year.
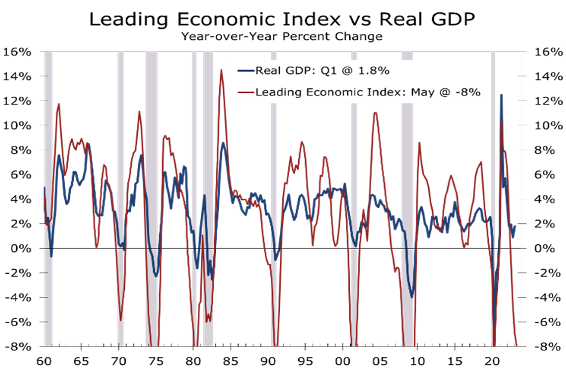
Source: Conference Board and Bureau of Economic Analysis
Measures of both real economic activity and financial conditions have contributed to the pullback in the LEI, with the ISM-Manufacturing new orders index and consumer sentiment both falling sharply. The spread between the 10-Year Treasury Note and the 3-Month T- Bill, which has been negative for the past 8 months, is another major contributor, as is the Conference Board’s measure of tightening credit conditions.
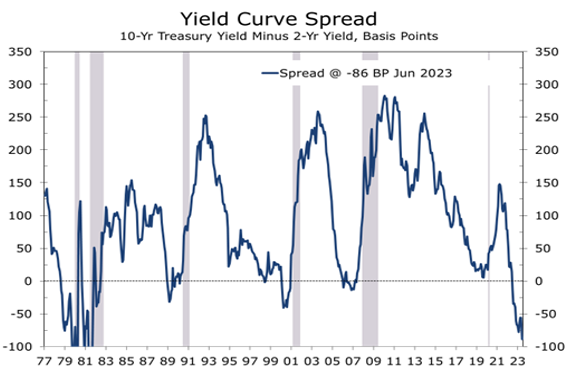
An alternative and more widely followed measure of the yield spread is the spread between the 10-Year Treasury Bond and 2-Year Treasury Note. That spread turned negative 13 months ago and has remained negative longer and fallen lower than any time since the early 1980s. Negative yield curves have been a reliable harbinger of recessions, with a negative yield curve preceding every recession since the 1970s.
The lag between when the yield curve inverts and when a recession begins has been between 6 months to 2 years. The average length is about 16 months, which would put the onset of a recession in the third or fourth quarter of this year. One important sidenote, the extent to which the yield curve is inverted has tended to narrow before a recession began.
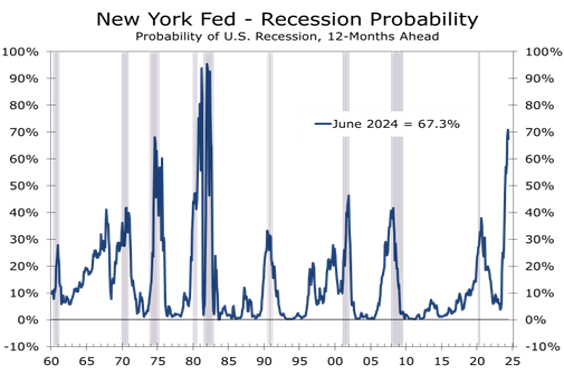
Source: Federal Reserve Bank of New York
The Federal Reserve Bank of New York produces a recession prediction model based off the slope of the yield curve. The most recent data show the risks of recession are already well above levels reached prior to the past three downturns, reaching an eye-popping 67% in June 2024.
The reason an inverted yield curve is such a good predictor of recessions is widely debated. One obvious explanation is an inverted yield curve reflects a rise in risk aversion about the business cycle, leading to less capital spending, lower inventories, and less hiring. A second and related explanation is that an inverted yield makes bank lending less profitable, which leads to tighter credit conditions and fewer loans.
The Leading Economic Index, inverted yield curve, and New York Fed’s recession probability model based off the yield curve make a compelling case that a recession is more likely than not by the middle of next year. That remains our forecast and the forecast for about 60% of professional forecasters that regularly submit economic forecasts to publicly reported media.
Source: Federal Reserve Board
There is still a clear path to a soft landing and that case has been getting stronger. Most notably, the inflation data are showing clear signs of moderating, which means the Fed is likely nearly finished hiking interest rates. Moreover, traditional measures of recession risk may be overstating the risk of recession.
The post-pandemic economy has been unusually difficult to read as there have been huge swings in employment, income, consumer spending, and capital investment that have occurred independently of one another. As a result, the economy is currently out of sync relative to most previous business cycles.
Consumer spending, which accounts for two-thirds of real GDP, is a good place to start. Pandemic relief payments enabled consumer spending to rocket back above its pre-pandemic levels just one month after the nationwide lockdown ended. Most of that initial spending burst was on goods. More recently, spending has shifted to services, and spending on goods has slowed or even fallen slightly.
The weakness in goods purchases has led to inventory drawdowns and cut new orders, which are one of the reasons ISM new orders and the LEI have been weak. In fact, the goods sector has been so weak that it has
resulted in a ‘freight recession’, with falling shipping volumes and declining shipping rates. Travel and leisure outlays, which are booming by all accounts, do not figure into the LEI nearly as much as goods do.
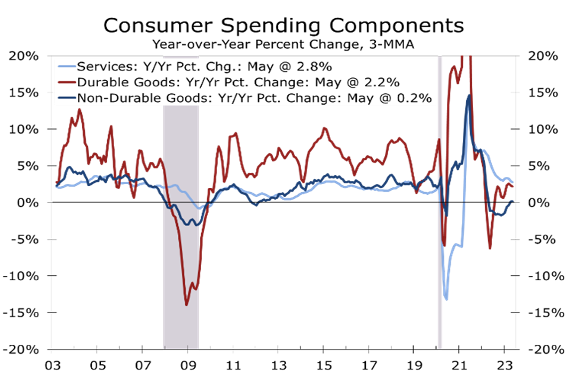
Source: Bureau of Economic Analysis
The emphasis on the goods sector is understandable. Most of the swing in real GDP during economic cycles comes from the goods sector. Spending for consumer durable goods, housing, and business fixed investment typically accounts for most of the decline in real GDP.
While the goods sector has seen some wild swings, the outlook for goods spending does not appear to be anywhere near as dire as the yield curve or LEI suggests.
For starters, light vehicle production is just rising back above its pre-pandemic levels and the supply of new and used cars has improved to the point that sales are rising. There is still substantial pent-up demand for cars and light trucks, although affordability will likely keep a relatively low ceiling on sales. There is also a huge backlog for automotive repairs that will keep body shops busy for months to come.
Home building is another area that is out of sync. The long period of ultra-low interest rates and pandemic-era housing boom resulted in many homeowners locking in generationally low mortgage rates. Sixty percent of outstanding first-lien mortgages are currently below 4%, with 80% below 5%. With such low rates, few homeowners are willing to put their homes on the market, bolstering demand for new homes. With inflation cooling off and the Fed nearly finished raising rates, there is a good chance single-family home building has already seen its lows for this cycle.
We remain concerned about the apartment market. There are more apartments under construction today than at any time since the early 1970s. Apartment starts will likely decline significantly as credit tightens. That will pull overall starts lower. Strength in single-family starts will offset much of this drag, however. The knock-on effects from single-family construction are huge, fueling demand for building products, financial services, furniture, appliances, security systems, lawn care, and all sorts of assorted other items.
There are also reasons to be optimistic about business investment. Demand for capital goods has been surprisingly strong, particularly electrical equipment, commercial aircraft, and heavy trucks. The AI revolution also appears to be kicking off another cycle in IT spending, while the CHIPS Act and Inflation Reduction Act are driving outlays for massive semiconductors plants, EV factories, and battery plants. Construction spending for new manufacturing facilities is running 72% ahead of its year-ago pace.
State and local government is another bright spot that is often overlooked. Pandemic relief to state and local governments helped bolster balance sheets and revenues recovered sooner than expected, leaving many states flush with cash. There has been a recent flurry of water projects around the country. The new infrastructure act will provide a further boost, although public works projects tend to evolve slowly.
While the path to a soft landing appears a little clearer, a recession later this year or early next year is still more likely than not. All the arguments for stronger economic growth are also arguments that inflation will prove more persistent. Much of the improvement in inflation has come from lower energy prices and fewer shortages in the auto sector. Inflation remains sticky in labor-intensive parts of the service sector.
Wage pressures may intensify further as the tight labor market emboldens workers to demand larger pay gains. The expanding Hollywood writers’ strike might foreshadow more challenging labor negotiations at UPS and the United Auto Workers this fall, setting a more inflationary undertone to wages in general.
Disclaimer: This publication has been prepared for informational purposes only and is not intended as a recommendation offer or solicitation with respect to the purchase or sale of any security or other financial product nor does it constitute investment advice. Any forward looking statements or forecasts are notguaranteed and are subject to change at any time. Information from external sources have not been verified but are generally considered reliable.
© 2023 CAVU Securities, LLC
Questions? Email: CompassReport@cavusecurities.com