
![]()
The 2024 Election Year Economic Outlook
- Most forecasters now expect the Federal Reserve to pull off a near-perfect soft landing in 2024, with economic growth slowing enough to allow inflation to ease further but not so much as to push unemployment higher. Our outlook remains slightly below the consensus, with economic activity expected to be just a touch softer than a traditional soft landing.
- The primary season is now underway, and the election is on the minds of business leaders, households, and policymakers. Presidential election years are generally thought to be good years for the economy. The record is far from definitive, however, with real GDP just rising 0.1 percentage points faster in presidential election years than its rolling 8-year average. We chose that period as it is roughly equivalent to the prior two presidential terms.
- The economy has had a decisive role in determining who wins or loses presidential elections. Over the past 16 presidential elections, dating back to 1960, the incumbent party has lost 6 of the 7 elections where the economy has grown less than its trailing 8-year average leading up to the election and gone on to win 6 of 8 of the elections where real GDP growth in the year preceding the election was stronger than the previous 8 years. This measure has worked 81.25% of the time.
- The current forecast for a soft landing puts the incumbent Biden Administration in a tough spot. If the economy achieves a soft landing, growth will trail its trailing 8-year average, signaling a likely loss. If growth comes in stronger than a soft landing, inflation will likely re-accelerate.
- We continue to look for real GDP growth to be just a touch softer than a soft landing, which should allow inflation to continue to decelerate and give the Fed the green light to cut interest rates. We also examine some traditional election year benchmarks, including the Misery Index, Real After-Tax Income Per Person, and Consumer Confidence.
The primary season is now underway, setting the stage for another critical presidential election year that captures the attention of business leaders, households, and policymakers alike. Traditionally, presidential election years are perceived as pivotal moments for the economy. Upon closer examination, however, the relationship between economic growth and election cycles is more nuanced.
Real GDP, our best measure of aggregate economic growth, has risen a modest increase of just 0.1 percentage points faster in presidential election years compared to its rolling 8-year average dating back to 1960. This marginal difference challenges the commonly held belief that election years are significantly more prosperous for the economy, as incumbents pull out all the stops via tax cuts, increased spending, or promised handouts.
Rather than bolstering economic performance, incumbent presidents and their political parties are likely to be at the mercy of the economy’s most recent performance. Over the past 16 presidential elections, incumbent parties have typically struggled when real GDP grew less than its trailing 8-year average leading up to the election, resulting in losses in 7 out of 8 those instances. Conversely, when election-year economic growth outpaces the previous 8 years, the incumbent party has won 6 out of 8 times. This straightforward measure has been correct 81.25% of the time.
As the presidential election year progresses, the relationship between economic performance and political outcomes will take center stage. The delicate balance between economic growth, inflation, and key economic benchmarks such as the Misery Index, Real After-Tax Income Per Person, and Consumer Confidence will shape the election season's narrative, influencing voters, business decisions, and policy choices. This issue of the CAVU Compass will briefly review these key concepts in the context of our latest economic forecast.
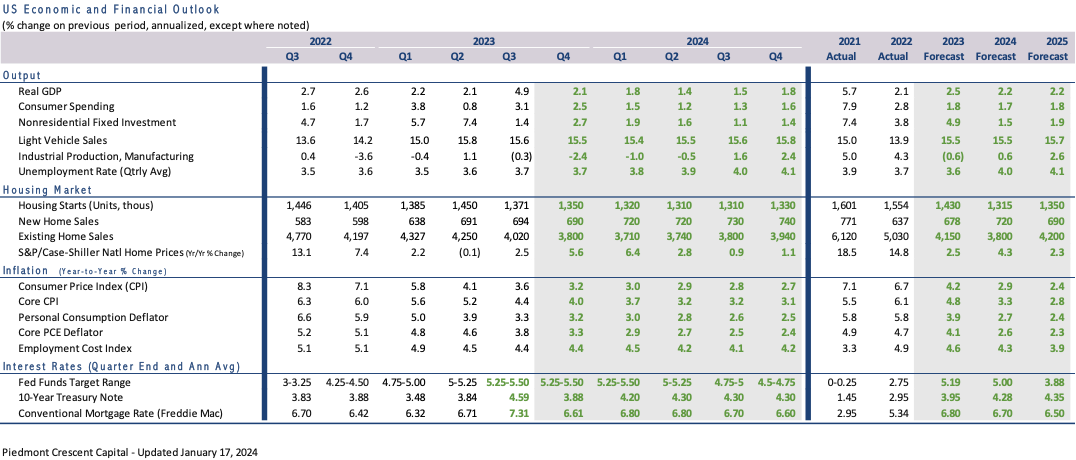
Real GDP is the most comprehensive measure of aggregate economic well-being. It quantifies the volume of goods and services produced by measuring aggregate purchases of finished goods and services on a net basis, encompassing consumers, businesses, governments, and international purchasers. Real GDP has risen 2.9% over the past year, primarily due to surprisingly strong growth in the third quarter of last year. The first look at Q4 GDP comes on January 25 and is expected to show growth decelerated to a 2.1% pace. We anticipate further moderation this year, with real GDP rising at a 1.6% pace on a fourth-quarter to fourth-quarter basis.
The current consensus is the U.S. economy will narrowly avoid a recession this year. The latest Wall Street Journal Economic Forecast Survey has real GDP growing just 1% in 2024. Job growth is expected to slow further and the unemployment rate edge higher from its current 3.7% to 4.3%. Inflation is expected to slow to 2.3% by yearend. The Survey calls for the Fed to cut interest rates three or four times beginning sometime in the first half of the year. Thirty-nine percent of economists expect the economy to fall into recession in 2024, down from 48% in October and 61% one year ago.
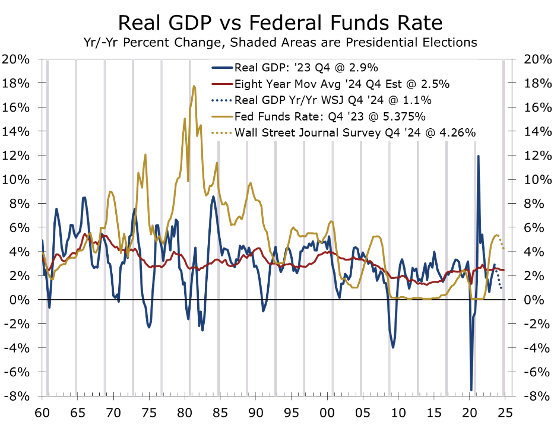
Source: Bureau of Economic Analysis, Federal Reserve & The Wall Street Journal
The soft landing scenario envisioned by the majority of economists will likely have an impact on the presidential election. Voters tend to vote with their wallets and incumbents have typically run into trouble when the economy is struggling. The consensus calls for real GDP to rise just 1% during the year leading up to the election. Such a result would yield growth 1.5 percentage points slower than real GDP growth has averaged over the past 8 years. That gap is significantly larger than the 0.9 percentage point gap averaged in the 9 elections since 1960 where incumbent party candidates lost and is one of the largest deviations, excluding recession years.
Our own forecast is a little more optimistic than the Wall Street Journal consensus even though we continue to look for the economy to be just a touch softer than a traditional soft landing. We look for real GDP to rise 1.7 percent from the fourth quarter of 2023 to the fourth quarter of 2024 and look for nonfarm employment growth to decelerate to a pace that produces a net gain of 110,000 jobs per month. Such an outcome would produce a slightly smaller gap (0.8 percentage points weaker) between economic growth in the year leading up to the presidential election than has been averaged in the 9 elections when the incumbent party lost. By contrast, winning incumbents have on average enjoyed economic growth that was 1.2 percentage points stronger in the year leading up to the presidential election than in the preceding eight years.
Comparing economic growth to its recent average is a bit more complicated today due to the extreme volatility in most measures of economic growth surrounding the pandemic, as well as the burst in economic activity that followed three successive rounds of direct stimulus payments to households and businesses. The economy has a great deal of stimulus in the pipeline, including the Inflation Reduction Act, the Bipartisan Infrastructure Act, the CHIPS and Science Act, and the Rescue and Recovery Act.
Fiscal policy was often used to boost growth ahead of presidential elections. The onslaught of stimulus following the pandemic has bloated the federal budget deficit, however, and will likely make it more difficult to provide additional fiscal stimulus this year. The budget deficit is expected to decline slightly this year, but slower economic growth will likely reduce tax receipts, while increased defense and security needs will pull spending higher. We look for the federal budget deficit to remain around its current 1.8 trillion this fiscal year.
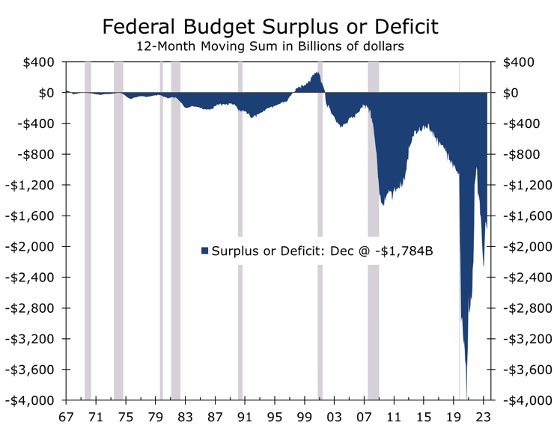
Source: U.S. Department of the Treasury
While the persistence of large budget deficits and periodic showdowns over continuing to fund the deficit generate a lot of headlines, the budget deficit itself has historically not been a major driver of election outcomes. The persistence of large budget deficits is not expected to have much of a direct influence on the 2024 election, although it will make it more difficult for policymakers to prime the pump before the election and might also exert some upward pressure on long-term interest rates.
One of the most popular measures of economic well-being during election years is the Misery Index. The Misery Index, created by economist Arthur Okun, is a simple measure that combines the inflation rate and unemployment rate to gauge the overall economic well-being of a country. Okun, who was an economic advisor to President Kennedy, introduced the concept in the 1960s to provide a straightforward assessment of the economic conditions affecting the average citizen. The index is calculated by adding the inflation rate, calculated from the 12-month change in the CPI, to the unemployment rate, providing a quick synopsis of economic conditions that is easy to compare over time.
The trend in the Misery Index has historically been more predictive than the absolute level. The index improved during the Kennedy Administration, which came into office during a time of stagflation, falling from 7.5% when Kennedy was elected in 1960 to 6.1%. Nearly all the improvement came from a reduction in the unemployment rate, which fell from 6.1% to 4.8%. The inflation rate fell from 1.4% to 1.3% during this period.
The Misery Index performance during the Kennedy Administration is instructive on how the inflation-unemployment tradeoff plays out in Democrat and Republican administrations. Successful democratic administrations have mostly focused on reducing unemployment, while republican administrations have seen more success in reducing inflation. The index rose during the Johnson Administration, climbing from 6.1% when Lyndon Johnson was elected to 8.1% in November 1960, when his successor Hubert Humphrey lost to Richard Nixon. All of the increase came from higher inflation. The unemployment rate actually declined.
The Misery Index gained prominence in the 1970s when stagflation emerged as a major economic problem. However, the index is far from perfect in predicting a presidential winner. Nixon secured a historic landslide re-election in 1972, despite a 0.9 percentage point rise in the Misery Index, solely attributable to a higher unemployment rate. Inflation slightly decreased during Nixon's first term. Gerald Ford assumed the presidency after the Watergate Scandal led to Nixon's resignation in August 1974. Ford inherited an economy grappling with both rising inflation and increasing unemployment.
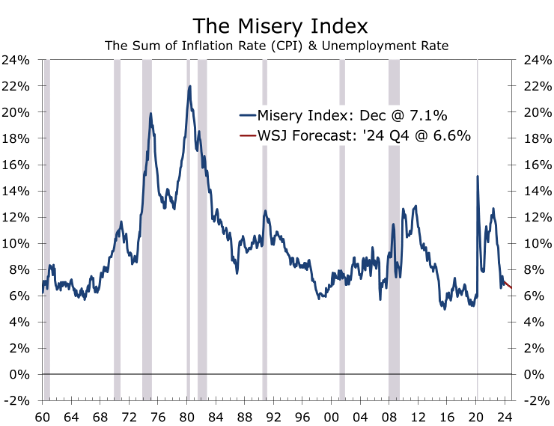
Source: Bureau of Labor Statistics & Piedmont Crescent Capital
Ford placed significant emphasis on combating inflation, introducing a program called Whip Inflation Now (Win). Although inflation did decrease during his presidency, the Misery Index still concluded his term 3.7 percentage points higher than when Nixon was re-elected in 1972 and 4.5 points higher than when Nixon was initially elected in 1968.
Jimmy Carter was quick to point out how much the Misery Index had risen in his successful bid for the White House in 1976. Unfortunately, containing inflation proved exceedingly difficult during Carter's presidency, which saw the inflation rate rise by 7.8 percentage points to 12.6% in November 1980. The unemployment rate actually fell by 0.3 percentage points during Carter's term but remained high at 7.5% on Election Day 1980. Reagan won the presidency in a historic landslide. The Misery Index improved significantly under Reagan, mostly due to sharply lower inflation, and he was handily re-elected in 1984.
The Misery Index improved further during Reagan's second term, paving the way for George Bush to win the presidency in 1988. However, the Misery worsened under his presidency, being 3 percentage points higher when he lost his re-election bid to Bill Clinton in 1992, with the entire increase attributed to a higher unemployment rate. The Misery Index improved during Clinton's first term, leading to his easy re-election. The Index has been less instructive in every presidential election since, however, as a lower Misery Index failed to provide enough of a boost to secure victory for Al Gore against George W. Bush. Additionally, slight improvements or worsening in the Misery Index have incorrectly predicted every election since.
One reason why the Misery Index has lost some of its luster in recent elections is that inflation was consistently low from the mid-1990s to the pandemic, shifting more attention to the unemployment rate and other issues. Of course, inflation spiked following the pandemic, and while it has been moderating recently, prices for groceries, housing, entertainment, and travel remain well above pre-pandemic levels. This may explain why such a small share of consumers currently rank current economic conditions as good.
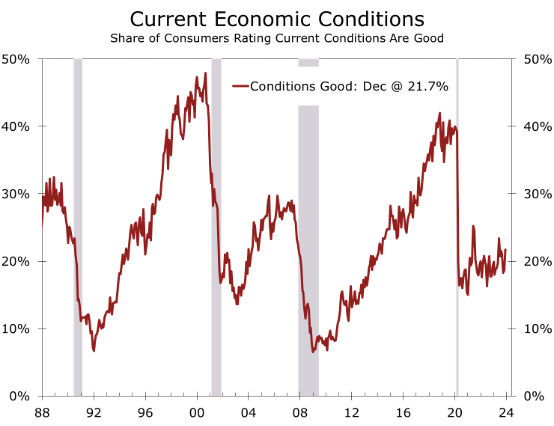
Source: The Conference Board
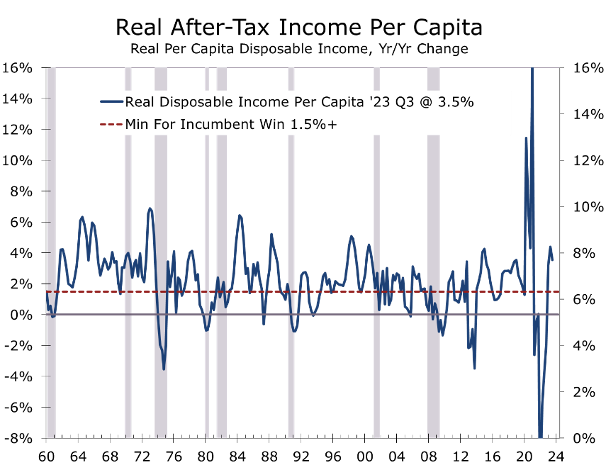
Another reliable measure of economic well-being that has correctly predicted the outcome of 10 of the past 16 presidential elections since 1960 is real after-tax income per person, which is also sometimes referred to as take-home pay minus inflation. The critical level in real per capita disposable income growth is 1.5% in the year preceding the presidential election. When take-home pay per person, minus inflation, rises by 1.5% or more in the year leading up to the presidential election, the incumbent or the person representing the party currently occupying the White House is almost always reelected.
Real after-tax disposable income is better than simply observing the change in the Misery Index and correctly projected Hillary Clinton would lose to Donald Trump in 2016. This measure has had some notable exceptions. Despite a 3.5% growth in real per capita disposable income in the year leading up to the 1968 election, Humphrey lost to Nixon, indicating economic factors alone did not secure victory. Humphrey's defeat was likely fueled by the nation's growing frustration with the Vietnam War, underscoring the influence of broader social and political issues on electoral outcomes.
Ford also experienced strong income gains in the year leading up to his 1976 reelection battle, with real take-home pay per capita rising by a solid 2.3%. Despite this economic boost, Ford lost, as simmering anger over the Watergate scandal overwhelmed the modest improvement in the economy. Similarly, Gore's loss to George W. Bush was likely influenced by some residual anger over the Monica Lewinsky affair and the subsequent impeachment of Bill Clinton. More recently, Trump’s narrow victory over Hillary Clinton in 2016 was likely fueled by lingering angst about the frustratingly slow recovery from the Global Financial Crisis.
The 2020 election miss is beyond the scope of this report. While real take-home pay per person surged by 4.3% in the year preceding the election, the year was marred by the COVID-19 Pandemic and massive relief efforts to contain the resulting economic damage. The income series has been unusually volatile since the pandemic due to repeated stimulus programs. The 3.5% increase over the past year would appear to be good news for Joe Biden, but growth has slowed more recently, with real take-home pay falling at a 0.3% annual rate in the most recent quarter. With economic growth slowing, we expect real take-home pay to rise very close to the 1.5% threshold needed for incumbents to be reelected.
Source: Bureau of Economic Analysis
The three benchmarks we introduced suggest this election cycle is likely to be tough for incumbents. Real GDP is expected to grow 0.8 percentage points slower this year than its average for the past 8 years, which has typically signaled a loss for the incumbent party occupying the White House. On the plus side, the Misery Index is projected to be 1.1 percentage points lower than when Biden was elected, with all of the improvement coming from lower unemployment. While inflation is expected to moderate, the CPI should still rise more than twice as much in 2024 as it did in the year preceding the 2020 election, and prices for key necessities are much higher than they were four years ago. Along those lines, real after-tax income per capita is likely to rise by 1.5% at best during the year leading up to the 2024 election. Based on recent experience, incumbents would lose, meaning the leadership of the White House, Senate, and House of Representatives would all likely change parties.
Predicting election outcomes is even more perilous than predicting the economy. A host of non-economic issues could easily overwhelm concerns about the economy, including global affairs, social issues, and the personal attributes of the candidates. The outcome of the election will have significant consequences on everything from geopolitics, global trade, the composition of the Fed and various regulatory agencies, and fiscal policy.
Our economic outlook is slightly more upbeat than it was a month ago. Real GDP in the fourth quarter now looks like it grew at a 2.1% annual rate, thanks to continued strong consumer spending and the continued buildout of a multitude of industrial projects. State and local government spending also looks to have risen solidly, given the continued growth in state and local government payrolls. Inventories are expected to grow more slowly and be a drag on Q4 growth.
We have also raised our 2024 forecast and now see growth just a touch softer than a soft landing, with real GDP expected to rise by 1.7%. Nonfarm employment is anticipated to decelerate, with employers adding only 110,000 jobs per month. The unemployment rate is predicted to increase to 4.1% by the end of the year. We maintain concern regarding traditional warning signals, such as the inverted yield curve and a 20-month decline in the Leading Economic Index. While the risk of a recession remains elevated, the more likely scenario is a continuation of the rolling recessions that have been ongoing for the past year.
Inflation is expected to continue to moderate, allowing the Fed to begin to cut interest rates this spring. Our forecast includes three quarter-point cuts in the federal funds rate, with the first in May or June. Another cut is expected in September and then the Fed will likely hold rates steady through the November election, after which a final cut is likely. Despite the bond market factoring in five or six quarter-point cuts this year, we do not foresee the economy weakening or inflation moderating enough to justify such extensive cuts. The 10-year Treasury is expected to rise back to 4.20%, which will keep mortgage rates in the 6.50% range through the end of the year.
Disclaimer: This publication has been prepared for informational purposes only and is not intended as a recommendation offer or solicitation with respect to the purchase or sale of any security or other financial product nor does it constitute investment advice. Any forward-looking statements or forecasts are notguaranteed and are subject to change at any time. Information from external sources have not been verified but are generally considered reliable.
© 2023 CAVU Securities, LLC
Questions? Email: CompassReport@cavusecurities.com